Spreadsheet after spreadsheet, analysts working on a Beaker implementation often live in an Excel-dominated world. This post offers a few helpful Excel tips to simplify build and analysis during your implementation.
#1 - Use the LEN() Function for Beaker's Character-Limited Fields
Many fields in Beaker, or Epic in general, have character limits. Whether you are giving a spreadsheet of OVTs abbreviations or assigning LRR base names, it can be tedious to count characters, especially when you are working with a dataset of hundreds of OVTs or thousands of LRRs. The LEN() function, in conjunction with conditional formatting, can count the number of characters being used in a cell and let you know if you go over the limit. Here's how to do it:
Highlight the column you'd like to character count and head to "Conditional Formatting" in your Excel header. Indicate that you want to create a new rule and that you want to create one that uses a formula. For the formula, you'll just enter LEN(your starting cell)>'your character limit'. So, for example, it might look like LEN(A1)>12. You'd then just set the format for the cell to indicate you have went over the limit - perhaps pink background with a red font.
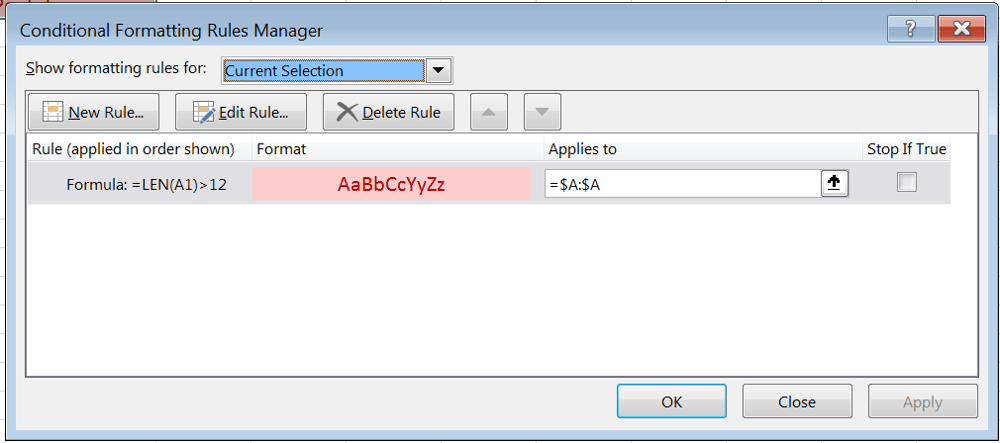
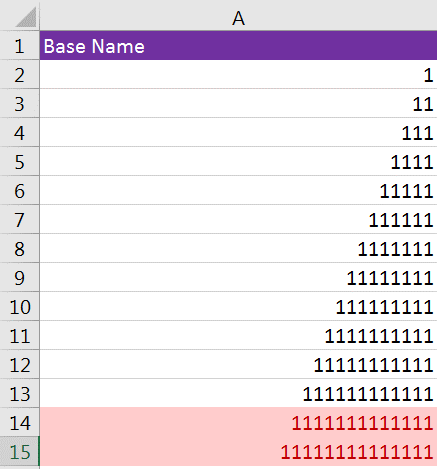
The result will be something like the image below. Notice that after we go above 12 characters, the cell automatically highlights in pink:
Keep in mind that you can also use Excel's conditional formatting to highlight cells that contain invalid characters. This can be helpful if you are having clinical leadership assign LRR base names (for example) by alerting them at the point of entry that an invalid character has been entered, saving you a follow-up down the road.
#2 - VLOOKUP() for Data Comparison/Matching of Beaker Records
Ahh, one of my absolute favorite tools that seems intimidating but is so, so easy to use. VLookup, in a nutshell, will let you compare and match data from two different datasets. Let's go over one specific example where I used this, though there are undoubtedly countless uses. For a new Beaker add-on implementation, I needed to attach legacy LIS test information to the already-existing lab EAPs in Epic. What container was being used? What section of the lab? None of that information lived in Epic, so how could I easily compile that information and join it to the already existing EAPs in Epic? I took an export of all EAPs in Epic that were mapped to the legacy LIS. I then requested an export from the legacy LIS with the information we needed. It was important to include a common data point in each export. The obvious link that we exported was the MPI mapping. So, I had two datasets - one including the EAP with mapping and the other including all the test information with the mapping. VLookup() was able to find the corresponding test information for each EAP and put them in the appropriate cells for an import spreadsheet. In addition to the compiling of data, this also helped us see which EAPs in Epic were not actually in use, preventing unneccessary test build and helping to clean up our EAPs.
Let's look at a super simple example of this function in action.
Epic Export on one tab:

Legacy LIS export on the other tab:

The function will look to the shared data point, the MPI. Here's what the function looks like:

Notice in the Table_array field, I used the dollar sign for each row/column indicator. This is important, especially for larger datasets, so that the full table will be searched when you copy the function down to all rows.
After completing the function, you will see your data pulled together:

Also notice that in my third row, there was no match found and Excel has entered "#N/A". This can be helpful to (at least in the example above) know which tests might not actually be in use.
#3 - Use the CONCATENATE() Function for Combining Information on Beaker Records
The CONCATENATE() function is a very simple, yet powerful tool that can save you a lot of time when creating Beaker records. Let's say you want to append a string in front of all of your record names. Perhaps you want the hospital's acronym in front of all the OVTs that you are going to use/build. Or, perhaps you want to prepend BKR for all LRRs that you are going to use for a Beaker add-on. Both are incredibly simple. Here's what your function would look like:

#4 - Insert a Blank Row after Every Other Row for Beaker Data Manipulation
Let's say that you want to delete a bunch of records, but the system asks for a confirmation for every record, preventing you from simply pasting in the list of records. Instead, you need to paste something like this, "Test1", "Yes", "Test2", "Yes", "Test3", "Yes", etc...
This is actually pretty easy to accomplish using Excel.
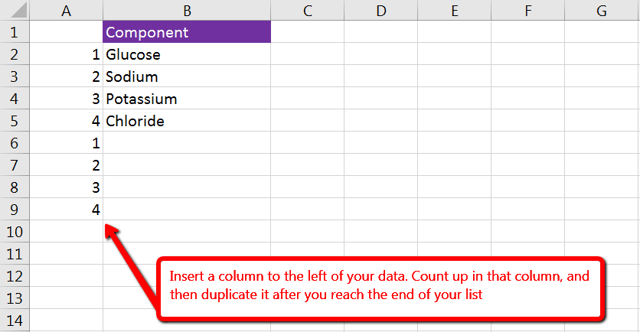
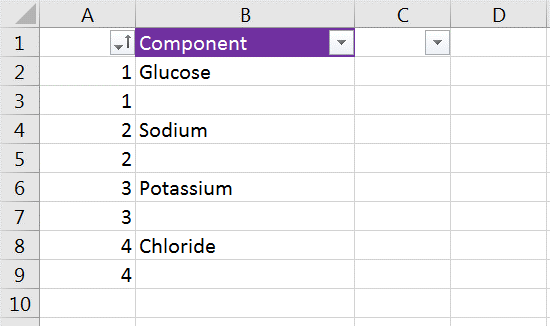
Insert a column to the left of your data and count up in that column for every row that has data. Then, duplicate that count below.
Now, simply sort the column from Smallest to Largest:
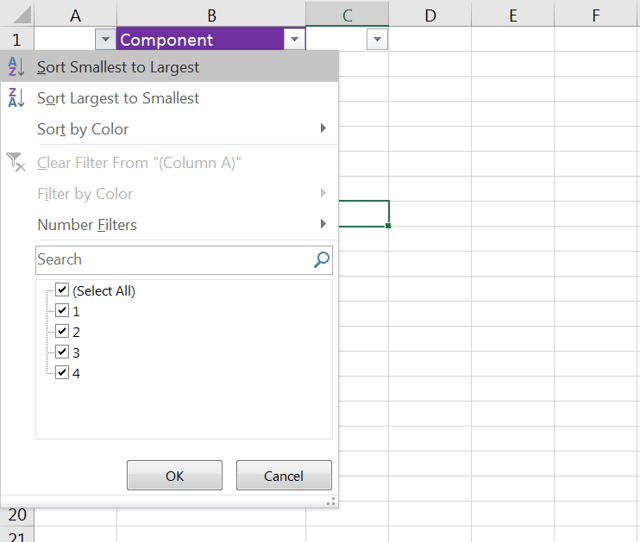
You should now see the blank rows in between each value:
Next, you can simply filter the column with your data (B, above), to *just* show blanks. Then, input the other string you want, such as, "Yes".
To wrap up, simply delete the added column and you're done! You can now grab copy the full list and paste it into your system to delete all of the records.
Have any other simple tips to help ease the Excel work on a Beaker implementation? Share it below in the comments!