With the rise in molecular infectious disease testing, especially during this particularly busy flu season, make sure you are delivering clean, user-friendly results to your physicians. In this post, I'll discuss a potential way to optimize your EHR and LIS for the delivery of molecular results in Beaker.
This flu season has been particularly busy. At the point of writing this post, the CDC's FluView indicates that flu is widespread in 49 of the 50 states.
 With such widespread influenza activity, flu testing volumes are undoubtedly high across the country. Most labs are offering the molecular-based respiratory pathogen panel, allowing for high-throughput, simultaneous detection of 20 unique pathogens. Luminex's product probes for these pathogens:

From a build standpoint, the simplest way to report these results would be to simply list each pathogen with the Detected/Not Detected result. Let's consider a result with 20 'Not Detected' results. In the chart, it would look something like this:
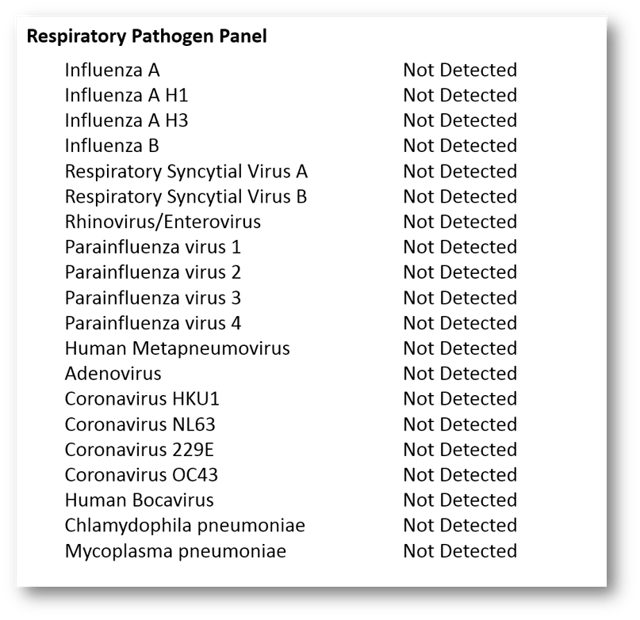
That's ugly. And busy. It's as long as a receipt from CVS and with all negative results, this could be far simpler and more user friendly.
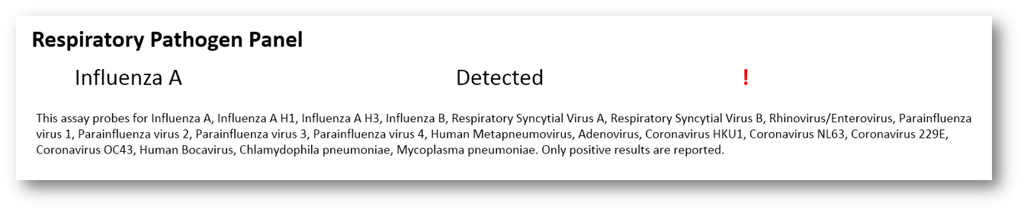
Let's consider another example where we have one detected pathogen. In the Chart it would look something like this:
 Your eye *is* drawn to the abnormal result, but it is far busier than needed.
Let's look at another way to structure and format these results that is much more user-friendly to the reading physician. In a nutshell, this format would follow the 'Chart-by-Exception' ideology. We would report out any Detected results and hide any Not Detected results. An automatic comment would fire in that would tell clinicians which pathogens were probed. Your medical director will craft the comment they'd like to have fire - something better than what I have in the examples below. For scenarios where no pathogens are detected, we'd have a generic "Respiratory Pathogen Panel" component that would simply be resulted with the negative result. Let's take a look at a few examples. First, let's look at an example with one detected pathogen. In the chart, it would look something like this:
That is a huge improvement. The important information is immediately evident and there is no extra waste on the screen.
Now, if no pathogens were detected, the results would look something like this:

A simple change, but one that greatly improves the ease at which these results are read, especially in the world of 'note bloat' and general information overload in the EHR. Usability is something that is too often overlooked.
To build this out, you'd simply use rule-based component reporting on your test looking to the value(s) you want to report to the chart. If you'd like to pursue this and have any questions, don't hesitate to reach out here. I'd be happy to help.
Are you the microbiology analyst at your hospital? If so, you might also appreciate another post of mine, on reflexing throat cultures from negative rapid strep tests.
Any comments? Leave them below!